
LIVE ONLINE CERTIFICATION

Research Statistics With R:

Intro to Statistical Methods for Health Sciences

Ready to unlock the power of R for Research Statistics?

Our 12-week part-time course connects you with R experts and a supportive community. You’ll build a portfolio of data projects, learn to program with tidyverse packages, and earn a certificate to showcase your R proficiency. The course includes:

👨‍💻 Is this course for you?

This course is ideal for researchers, analysts, and professionals in the life sciences, medical sciences, and social sciences who want to apply rigorous statistical methods to real data using R. A basic familiarity with the R programming language is required. If you are looking for a coding-focused introduction to R before diving into statistics, consider taking our R Basics & Beyond course first.

Tuition: $175 per month (x3 months)

Financial hardship scholarships available.
Indicate your need in the standard enrollment form.

We offer a generous 1-month full refund policy so you can try the course risk-free.

Course Structure

Duration

12 weeks

Next Course Offerings

Trimester 2: May 21 - Aug 6, 2026

Prerequisite

Basic R coding experience

Location

Online classroom

Weekly 2-hr Workshops (pick one session)

Thursdays 10am GMT (check local time)
Thursdays 3pm GMT (check local time)
Sundays 2pm GMT (check local time)

quotes.png

Hear from GRAPH Graduates

Course Modules

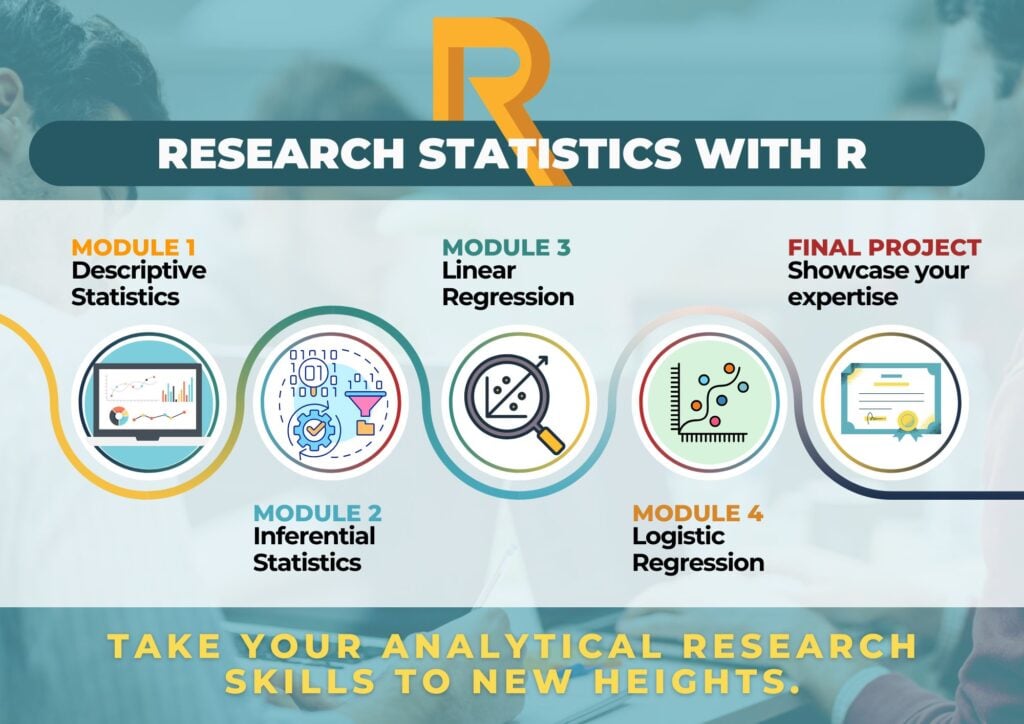
Descriptive Statistics

Build your statistical foundation with R. Explore data types and distributions, visualise health datasets using ggplot2, and calculate key measures of central tendency and dispersion including mean, median, standard deviation, z-scores, and the normal distribution. 

DURATION: 1 week

TOPICS
Data types & variable classification, histograms & density curves with ggplot2, mean / median / mode, measures of dispersion, z-scores, normal distribution, binomial & Poisson distributions

Inferential Statistics

Move from describing data to drawing conclusions. Master sampling distributions, the Central Limit Theorem, standard error, and confidence intervals. Then test scientific hypotheses with rigour interpreting p-values, controlling for Type I & II errors, comparing group means with t-tests, running ANOVA across multiple groups, and analysing categorical associations with chi-square tests. All applied to real epidemiological and clinical datasets in R.

DURATION: 2 weeks

TOPICS Sampling distributions, Central Limit Theorem, standard error, confidence intervals, p-values, alpha levels, Type I & II errors, effect size, independent & paired t-tests, ANOVA, post-hoc tests, chi-square tests, contingency tables

Linear Regression

Model and predict continuous health outcomes. Fit simple and multiple linear regression models in R, interpret coefficients and R², check assumptions (linearity, homoscedasticity, normality), manage confounding and multicollinearity, and apply log and polynomial transformations. Produce publication-ready regression tables and visualisations for health research reports.

DURATION: 3 weeks

TOPICS
Simple linear regression, slope & intercept, R², residual diagnostics, homoscedasticity, normality checks, multiple predictors, confounding, multicollinearity, adjusted R², log & polynomial transformations, regression reporting

Logistic Regression

Analyse binary health outcomes such as disease status, treatment response, and mortality risk. Fit simple and multiple logistic regression models in R, interpret odds ratios, evaluate model fit with ROC curves, handle effect modification and rare events, and present adjusted results in research-quality tables suitable for publication.

DURATION: 3 weeks

TOPICS 
Binary outcomes, log odds, odds ratios, probability, ROC curves, sensitivity & specificity, AUC, adjusted odds ratios, covariate selection, interactions, effect modification, rare events, logistic regression reporting

Capstone Project

Demonstrate your full statistical expertise on a real public health dataset. Working independently, you will clean and explore data, apply appropriate hypothesis tests, and build regression models  then present your findings as a polished written paper with a fully reproducible R script. Projects are presented to peers and evaluated by instructors as a tangible demonstration of competency.

DURATION: 3 weeks

TOPICS 
Data cleaning & exploration, exploratory data analysis, hypothesis testing, regression modelling, results interpretation, written public health report, reproducible R script, peer presentation

Our Approach

Supportive Community

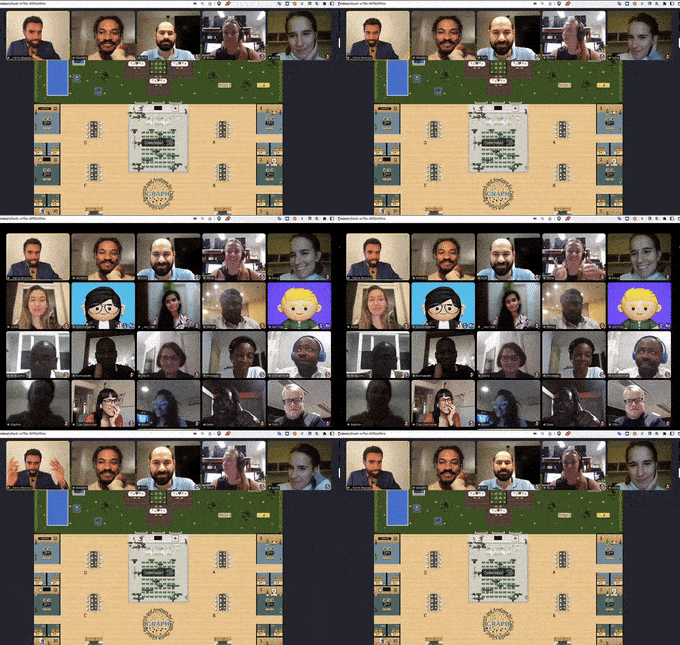
Online learning can be isolating. Our live classes and study halls create a vibrant community of aspiring data analysts. 

– Hello from a recent cohort!

– An example page from a student’s capstone Project

Hands-on Learning

Theory is important, but application is key. Throughout the course, you’ll work on real-world projects that demonstrate your growing skills to potential employers.

Modern Curriculum

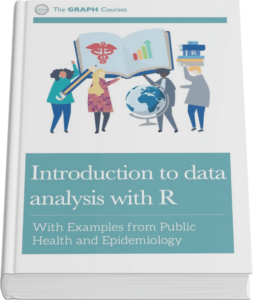
There is a lot to learn in the R space. Figuring out what’s essential can be challenging. Our experts have curated a focused curriculum that covers the most important and up-to-date aspects of R for data analysis.

– One of our textbooks. Available online at datawithr.com

Course Creators & Tutors

Meet our passionate team of data analysis professionals. 

Prof. Olivia Keiser

Course Advisor

Head of the Mathematical Modelling & Infectious Diseases Division, University of Geneva; GRAPH Network Director

Dr Sara Botero Mesa

Course Advisor

Scientific Collaborator at the University of Geneva | COO  of the GRAPH Network

Kenechukwu Nwosu

Course creator & Tutor

Research Assistant at the University of Geneva; GRAPH Courses Director

Joy Vaz

Instructional lead

GRAPH Network Training Coordinator and Instructor

Camille Valera

Course Creator & Tutor

Project Manager and Scientific Collaborator, the GRAPH Network

sabina Rodriguez Velásquez

Course Creator & Tutor

Project Manager and Scientific Collaborator, the GRAPH Network

Santiago Sotelo

Course Instructor

Data Scientist at PUCP; GRAPH Courses Tutor

Prof. Flavio Coelho

Course Advisor

Associate professor of Mathematical Epidemiology Getulio Vargas Foundation, Rio de Janeiro; EpiGraphHub Director

Dr. Guy Sadeu Wafeu

Course creator & Tutor

Dept. of Internal Medicine, University of Yaounde; GRAPH Courses Tutor.