-
Information sur le cours
Rencontrez l'équipe enseignante -
Jeu de données du cours 1
-
Jeu de données du cours 2
-
MODULE A1: INTRODUCTION AUX STATISTIQUES AVEC R ET STATAA1.1 Qu'est-ce que les Statistiques?
-
A1.2.1a Introduction à Stata
-
A1.2.2b: Introduction à R
-
A1.2.2c: Introduction to SPSS
-
A1.3: Statistiques Descriptives
-
A1.4: Estimations et Intervalles de Confiance
-
A1.5: Tests d'Hypothèses
-
A1.6: Transformation de Variables
-
Fin du Module A11 Quiz
-
MODULE A2: CALCULS DE PUISSANCE STATISTIQUE & DE TAILLE D’ÉCHANTILLONA2.1 Concepts Clés
-
A2.2 Calculs de puissance pour une différence de moyennes
-
A2.3 Calculs de puissance pour une différence de proportions
-
A2.4 Calcul de taille d’échantillon pour les essais randomisés (RCTs)
-
A2.5 Calculs de taille d’échantillon pour les études transversales (ou sondages)
-
A2.6 Calcul de taille d'échantillon pour un devis cas-contrôle
-
Fin du Module A21 Quiz
-
MODULE B1: RÉGRESSION LINÉAIREB1.1 Corrélation et Nuages de Points (scatterplots)
-
B1.2 Différences Entre Moyennes (ANOVA à un facteur)
-
B1.3 Régression Linéaire Univariée
-
B1.4 Régression Linéaire Multivariée
-
B1.5 Sélection de Modèles et Tests F
-
B1.6 Diagnostics de Régression
-
Fin du Module B11 Quiz
-
MODULE B2: COMPARAISONS MULTIPLES & MESURES RÉPÉTÉESB2.1 ANOVA Approfondie— Tests Post-Hoc
-
B2.2 Correction pour Comparaisons Multiples
-
B2.3 ANOVA à deux facteurs (Two-way ANOVA)
-
B2.4 Mesures Répétées et Test T Apparié
-
B2.5 ANOVA pour Mesures Répétées
-
Fin du Module B21 Quiz
-
MODULE B3: MÉTHODES NON-PARAMETRICB3.1 Hypothèses des Tests Paramétriques
-
B3.2 Test U de Mann-Whitney
-
B3.3 Test de Kruskal-Wallis
-
B3.4 Test des rangs signés de Wilcoxon
-
B3.5 Test de Friedman
-
B3.6 Corrélation des Rangs de Spearman
-
Fin du Module B31 Quiz
-
MODULE C1: DONNÉES BINAIRES & RÉGRESSION LOGISTIQUEC1.1 Introduction à la prévalence, au Risque, aux Cotes (Odds) et aux Taux
-
C1.2 Le Test du Chi Carré & le Test de Tendance
-
C1.3 Régression Logistique Univariée
-
C1.4 Régression Logistique Multivariée
-
Fin du Module C11 Quiz
-
MODULE C2: DONNÉES DE SURVIEC2.1 Introduction aux Données de Survie
-
C2.2 Fonction de Survie de Kaplan-Meier & Test du Log-Rank
-
C2.3 Régression de Cox à Risque Proportionnel
-
C2.4 Régression de Poisson
-
Fin du Module C21 Quiz

Learning Outcomes
By the end of this section, students will be able to:
- Open datasets in their chosen statistical software programme
- Explore datasets and understand what data they have
- Use basic commands to edit their data
IBM Statistical Package for the Social Sciences (or SPSS) is a user friendly software package for conducting statistical analysis. This does not mean that this software is only useful for social science data, the name is just a nod to its origins and the team of social scientists who developed SPSS v1 back in 1968. We are currently on SPSS v29 and the modern version of SPSS allows us to perform a wide array of statistical tests and it can handle the majority of situations, as you will see throughout this course. SPSS has a very intuitive user interface, it allows you to easily visualise your data, and it is very useful for students who have not had much experience of statistical analysis OR coding before, so you are not having to learn a programming language at the same time as learning how to do statistics. If you are planning to analyse large epidemiological datasets, or so a lot of complex statistical modelling, there are some functions you may need which SPSS cannot perform, or cannot do as well as one of the other software packages on this course. If this is your aim, you might be better learning to use Stata or R.
Once you have your software installed watch the below video and work your way through the practical exercise to set up and investigate your course datasets.
The instructions for this course assume you are using SPSS v29. If you are using an earlier version some of the instructions may not match exactly, but changes of core functions between versions are minimal and you should be able to follow along.
A1.2.3 PRACTICAL: SPSS
Use the steps described in the video to open the FoSSA Whitehall data set in SPSS.
Visit the ‘Variables’ tab and classify each of the variables as ‘nominal’, ‘ordinal’ or ‘scale’ depending on the variable type. Refer back to the information on the course data within the course information section if you are unsure.
Categorical variables can be treated by SPSS as either nominal, where categories have no order (e.g. Yes/No) or ordinal, where categories can put put in a logical order from smallest to largest (e.g. age groups). Scale in SPSS means any continuous variable.
Then add your value labels for all categorical variables. This is where you input each value that is used to represent a category and assign that category a name. You can copy and paste value label sets from one variable to another. So if, as with this dataset, there are lots of Yes/No categorical variables, you can define that 0 = No and 1 = Yes in one variable, and then copy and paste that into all of the others.
Once you have completed all of your value labels, if you go back to the data tab and press the button, you will see the labels appear in place of the category codes. You can use this option to toggle back and forth between codes and labels whenever you need to, but the important use of labels is that they appear on your test outputs, so you do not need to keep referring back to your notes to interpret your results.
Once you have set up the FoSSA Whitehall dataset, use the same process to set up the FoSSA Mouse dataset.
Answer
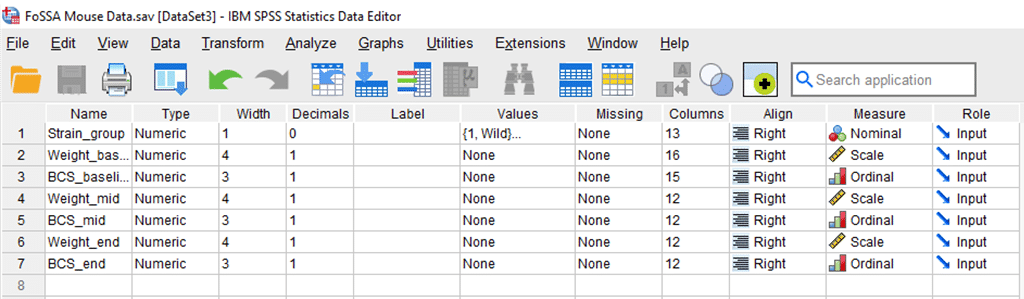
Once you have set up your FoSSA Whitehall dataset, your variables tab should look like this.
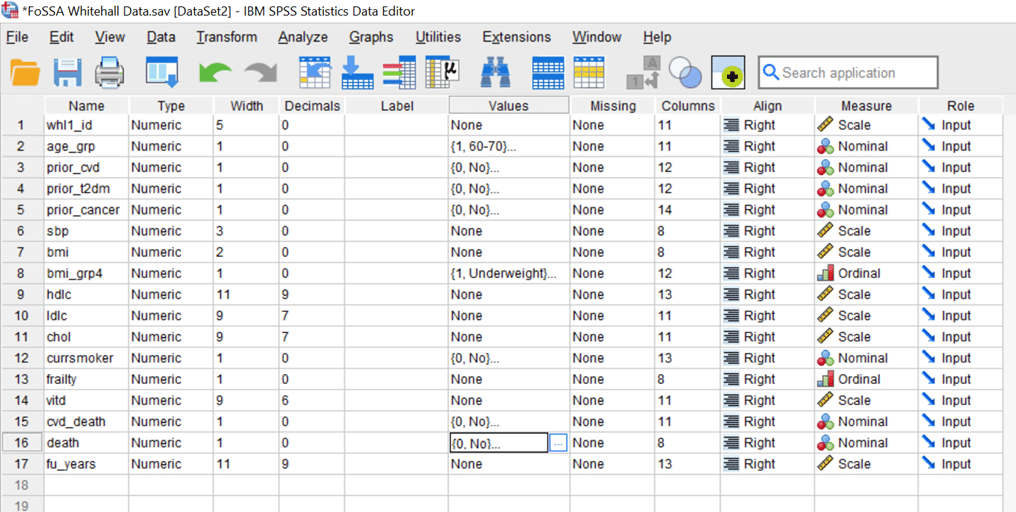
Once you have set up the FoSSA Mouse dataset, your variables tab should look like this. Remember, even though BCS variables are considered ordinal, the numbers are not a code for anything else.