-
MODULE 1: SIR Model Basics
Introduction to Compartmental Models for Infectious Disease -
Introduction to Ordinary Differential Equations (ODEs) and the SIR Model
-
Introduction to SIR Modelling in R
-
MODULE 2: SIR Model ExtensionsModelling Density-dependent vs. Frequency-dependent Transmission
-
SIR model with Demographics
-
CASE STUDY: Modelling with Real-World DataSEIR & SEIRW models for Hepatitis E Virus (HEV) Outbreaks: A Case Study
-
MODULE 3: Epidemic ThresholdsThe Basic Reproduction Number (R0)
-
The Effective Reproduction Number (Re)
-
Vaccination and Herd Immunity
-
Practical Example: Models for Infectious Disease Management & PolicyVaccination Strategies to Control Hepatitis E Outbreaks: A Modeling Study (Cooper et al. 2018)
Lesson Video
🚗 Video too fast or too slow? Click the gear icon ⚙️ at the bottom-right to change the speed!
Click here to view and download this video from Vimeo.
Lesson Code & Data
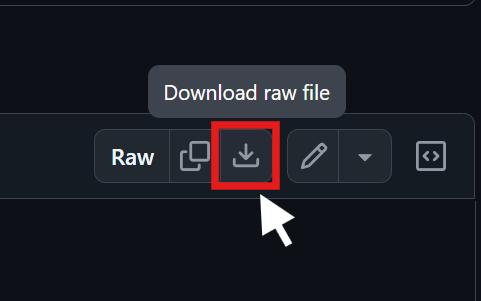
Please download the R Markdown script and data file linked below to code along with the instructor.
You need to click the download button on the top right menu.
got this ODE option, why don’t we have the N factored in ours
seir_model <- function(time, state, parameters) { with(as.list(c(state, parameters)), { N <- S + E + I + R dS <- -beta * S * I / N dE <- beta * S * I / N - sigma * E dI <- sigma * E - gamma * I dR <- gamma * I list(c(dS, dE, dI, dR)) }) }Hello! It looks like you are using the ODEs for a frequency-dependant model. For a density-dependent model, you don’t need to factor N into the equations.
Wow, this makes modelling seem less intimidating. I have a question: Is it always necessary to plot all 3 graphs in the SIR model or just the “Infected” curve would be enough?
Glad to hear that you are enjoying the course! There is no need to plot all 3 curve every time, you can feel free to focus on the Infected curve. We usually plot all three just to inspect model outputs.
Thanks