-
Course Information
Meet the Teaching Team -
Course Dataset 1
-
Course Dataset 2
-
MODULE A1: INTRODUCTION TO STATISTICS USING R, STATA, AND SPSSA1.1 What is Statistics?
-
A1.2.1a Introduction to Stata
-
A1.2.2b: Introduction to R
-
A1.2.2c: Introduction to SPSS
-
A1.3: Descriptive Statistics
-
A1.4: Estimates and Confidence Intervals
-
A1.5: Hypothesis Testing
-
A1.6: Transforming Variables
-
End of Module A11 Quiz
-
MODULE A2: POWER & SAMPLE SIZE CALCULATIONSA2.1 Key Concepts
-
A2.2 Power calculations for a difference in means
-
A2.3 Power Calculations for a difference in proportions
-
A2.4 Sample Size Calculation for RCTs
-
A2.5 Sample size calculations for cross-sectional studies (or surveys)
-
A2.6 Sample size calculations for case-control studies
-
End of Module A21 Quiz
-
MODULE B1: LINEAR REGRESSIONB1.1 Correlation and Scatterplots
-
B1.2 Differences Between Means (ANOVA 1)
-
B1.3 Univariable Linear Regression
-
B1.4 Multivariable Linear Regression
-
B1.5 Model Selection and F-Tests
-
B1.6 Regression Diagnostics
-
End of Module B11 Quiz
-
MODULE B2: MULTIPLE COMPARISONS & REPEATED MEASURESB2.1 ANOVA Revisited - Post-Hoc Testing
-
B2.2 Correcting For Multiple Comparisons
-
B2.3 Two-way ANOVA
-
B2.4 Repeated Measures and the Paired T-Test
-
B2.5 Repeated Measures ANOVA
-
End of Module B21 Quiz
-
MODULE B3: NON-PARAMETRIC MEASURESB3.1 The Parametric Assumptions
-
B3.2 Mann-Whitney U Test
-
B3.3 Kruskal-Wallis Test
-
B3.4 Wilcoxon Signed Rank Test
-
B3.5 Friedman Test
-
B3.6 Spearman's Rank Order Correlation
-
End of Module B31 Quiz
-
MODULE C1: BINARY OUTCOME DATA & LOGISTIC REGRESSIONC1.1 Introduction to Prevalence, Risk, Odds and Rates
-
C1.2 The Chi-Square Test and the Test For Trend
-
C1.3 Univariable Logistic Regression
-
C1.4 Multivariable Logistic Regression
-
End of Module C11 Quiz
-
MODULE C2: SURVIVAL DATAC2.1 Introduction to Survival Data
-
C2.2 Kaplan-Meier Survival Function & the Log Rank Test
-
C2.3 Cox Proportional Hazards Regression
-
C2.4 Poisson Regression
-
End of Module C21 Quiz


Learning Outcomes
By the end of this section, students will be able to:
- Explain the key concept of power and what impacts it
- Estimate the power of a given study
- Estimate the sample size needed to test hypotheses in different study designs
You can download a copy of the slides here: A2.4: Sample Size Calculations for RCTs
Video A2.4 Sample Size Calculation for RCTs (11 minutes)
A2.4 PRACTICAL: R
Sample size calculation for testing a hypothesis (Clinical trials or clinical interventional studies)
Here is an example:
In a parallel RCT, 25% of the subjects on the standard therapy had a successful outcome. It is only of clinical relevance if a 40% absolute improvement is observed in the new therapy. How many subjects are required in order to detect this difference with 80% power at the 5% level of significance?
In this case we need to assess a difference in proportions again, this time with an effect size that has a 0.40 difference between the groups:
> power6<-pwr.2p.test(h=ES.h(p1=0.25, p2=0.65), power=0.8, sig.level=0.05)
> power6
Difference of proportion power calculation for binomial distribution (arcsine transformation)
h = 0.8282914
n = 22.88076
sig.level = 0.05
power = 0.8
alternative = two.sided
NOTE: same sample sizes
23 subjects per group and 46 subjects are required in total.
Question A2.4: In the same parallel trial as described in the example above, we still observe that 25% of the subjects on the standard therapy had a successful outcome, but this time it is only of clinical relevance if a 40% relative improvement is observed in the new therapy. How many subjects are required in order to detect this difference with 80% power at the 5% level of significance?
Answer
First you need to work out what a 40% relative increase on 25% is: 0.25*1.40=35% of subjects would need to have a successful outcome for there to be clinical relevance.
> power7<-pwr.2p.test(h=ES.h(p1=0.25, p2=0.35), power=0.8, sig.level=0.05)
> power7
Difference of proportion power calculation for binomial distribution (arcsine transformation)
h = 0.2189061
n = 327.5826
sig.level = 0.05
power = 0.8
alternative = two.sided
NOTE: same sample sizes
We need many more patients than in the example above due to the small effect size that we now wish to detect.
A2.4 PRACTICAL: Stata
Sample size calculation for testing a hypothesis (Clinical trials or clinical interventional studies)
Here is an example:
In a parallel RCT, 25% of the subjects on the standard therapy had a successful outcome. It is only of clinical relevance if a 40% absolute improvement is observed in the new therapy. How many subjects are required in order to detect this difference with 80% power at the 5% level of significance?
power twoproportions 0.25 0.65, alpha(0.05) power(0.80)
*– Estimated sample sizes:
N = 48
N per group = 24
24 subjects per group and 48 subjects are required in total.
Question A2.4: In the same parallel trial as described in the example above, we still observe that 25% of the subjects on the standard therapy had a successful outcome, but this time it is only of clinical relevance if a 40% relative improvement is observed in the new therapy. How many subjects are required in order to detect this difference with 80% power at the 5% level of significance?
Answer
First you need to work out what a 40% relative increase on 25% is: 0.25*1.40=35% of subjects would need to have a successful outcome for there to be clinical relevance.
power twoproportions 0.25 0.35, alpha(0.05) power(0.80)
Estimated sample sizes for a two-sample proportions test
Pearson’s chi-squared test
Ho: p2 = p1 versus Ha: p2 != p1
Study parameters:
alpha = 0.0500
power = 0.8000
delta = 0.1000 (difference)
p1 = 0.2500
p2 = 0.3500
Estimated sample sizes:
N = 658
N per group = 329
We need many more patients than in the example above due to the small effect size that we now wish to detect.
A2.4 PRACTICAL: SPSS
Sample size calculation for testing a hypothesis (Clinical trials or clinical interventional studies)
In a parallel RCT, 25% of the subjects on the standard therapy had a successful outcome. It is only of clinical relevance if a 40% absolute improvement is observed in the new therapy. How many subjects are required in order to detect this difference with 80% power at the 5% level of significance? Use the same test as in the previous practical (Independent Samples Binomial Test) but adapt the input values for this scenario.
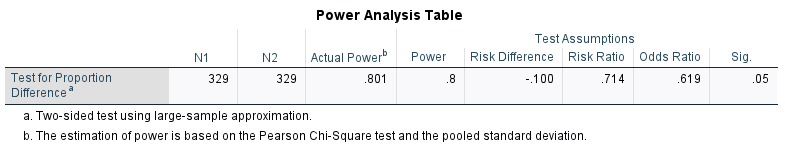
In the same parallel trial as described in the example above, we still observe that 25% of the subjects on the standard therapy had a successful outcome, but this time it is only of clinical relevance if a 40% relative improvement is observed in the new therapy. How many subjects are required in order to detect this difference with 80% power at the 5% level of significance?
Answer
In the first part we calculate that 24 subjects per group and 48 subjects are required in total when we are looking for 40% absolute difference.

In the second part, we first need to work out what a 40% relative increase on 25% is (0.25*1.40=35%). Therefore 35% of subjects would need to have a successful outcome for there to be clinical relevance.
When we conduct the test we calculate that we need 329 subjects per group and 658 overall.
We need many more patients than in the example above due to the small effect size that we now wish to detect.