
-
Course Information
Meet the Teaching Team -
Course Dataset 1
-
Course Dataset 2
-
MODULE A1: INTRODUCTION TO STATISTICS USING R, STATA, AND SPSSA1.1 What is Statistics?
-
A1.2.1a Introduction to Stata
-
A1.2.2b: Introduction to R
-
A1.2.2c: Introduction to SPSS
-
A1.3: Descriptive Statistics
-
A1.4: Estimates and Confidence Intervals
-
A1.5: Hypothesis Testing
-
A1.6: Transforming Variables
-
End of Module A11 Quiz
-
MODULE A2: POWER & SAMPLE SIZE CALCULATIONSA2.1 Key Concepts
-
A2.2 Power calculations for a difference in means
-
A2.3 Power Calculations for a difference in proportions
-
A2.4 Sample Size Calculation for RCTs
-
A2.5 Sample size calculations for cross-sectional studies (or surveys)
-
A2.6 Sample size calculations for case-control studies
-
End of Module A21 Quiz
-
MODULE B1: LINEAR REGRESSIONB1.1 Correlation and Scatterplots
-
B1.2 Differences Between Means (ANOVA 1)
-
B1.3 Univariable Linear Regression
-
B1.4 Multivariable Linear Regression
-
B1.5 Model Selection and F-Tests
-
B1.6 Regression Diagnostics
-
End of Module B11 Quiz
-
MODULE B2: MULTIPLE COMPARISONS & REPEATED MEASURESB2.1 ANOVA Revisited – Post-Hoc Testing
-
B2.2 Correcting For Multiple Comparisons
-
B2.3 Two-way ANOVA
-
B2.4 Repeated Measures and the Paired T-Test
-
B2.5 Repeated Measures ANOVA
-
End of Module B21 Quiz
-
MODULE B3: NON-PARAMETRIC MEASURESB3.1 The Parametric Assumptions
-
B3.2 Mann-Whitney U Test
-
B3.3 Kruskal-Wallis Test
-
B3.4 Wilcoxon Signed Rank Test
-
B3.5 Friedman Test
-
B3.6 Spearman’s Rank Order Correlation
-
End of Module B31 Quiz
-
MODULE C1: BINARY OUTCOME DATA & LOGISTIC REGRESSIONC1.1 Introduction to Prevalence, Risk, Odds and Rates
-
C1.2 The Chi-Square Test and the Test For Trend
-
C1.3 Univariable Logistic Regression
-
C1.4 Multivariable Logistic Regression
-
End of Module C11 Quiz
-
MODULE C2: SURVIVAL DATAC2.1 Introduction to Survival Data
-
C2.2 Kaplan-Meier Survival Function & the Log Rank Test
-
C2.3 Cox Proportional Hazards Regression
-
C2.4 Poisson Regression
-
End of Module C21 Quiz
-
A Note about the Fossa Certificate



Learning Outcomes
By the end of this section, students will be able to:
- Explain the importance of the parametric assumptions and determine if they have been met
- Explain the basic principles of rank based non-parametric statistical tests
- Describe the use of a range of common non-parametric tests
- Conduct and interpret common non-parametric tests
You can download a copy of the slides here: B3.6 Spearman’s Rank Order Correlation
B3.6 PRACTICAL: R
For the last practical in this module, you are going to perform a test of correlation on non-parametric data using the Spearman’s Rank Order Correlation.
This can be conducted using the cor.test command, which has the structure:
cor.test(data, variable 1, variable 2, method=””)
We can specify spearman as the method to conduct a Spearman’s rank test. If the method is not specified, the default is Pearson’s correlation.
Question B3.6: What is the spearman correlation between Weight_end and BCS_end?
Answer
We can use the cor.test command with the structure specified above:
> cor_test(data, Weight_end, BCS_end, method = “spearman”)
This gives the following RStudio output:

We can see that there is a significant (p<0.05) correlation between the body condition score and the weight of the mice at the end of the study and their correlation coefficient is 0.81.
B3.6 PRACTICAL: Stata
For the last practical in this module, you are going to perform a test of correlation on non-parametric data using the Spearman’s Rank Order Correlation.
The command in Stata is
spearman [varlist] [if] [in] [, spearman_options]
We can put multiple variables on the command line where it states [varlist].
Question B3.6: What is the spearman correlation between Weight_end and BCS_end?
Answer

Here you would report an rs value of 0.814 and a significant correlation with P<0.001.
B3.6 PRACTICAL: SPSS
For the last practical in this module, you are going to perform a test of correlation on non-parametric data using the Spearman’s Rank Order Correlation.
Select
Analyze >> Correlate >> Bivariate
Move the two variables you are interested in into the Test Variables box. Here we are going to look at BCS_end and Weight_end.
If you put more than two variables into the Test Variables box, SPSS will perform the selected test of correction on all possible combinations.
Make sure ‘Spearman’ is selected at the bottom of the box before you press ‘OK’ to run the test.

Answer
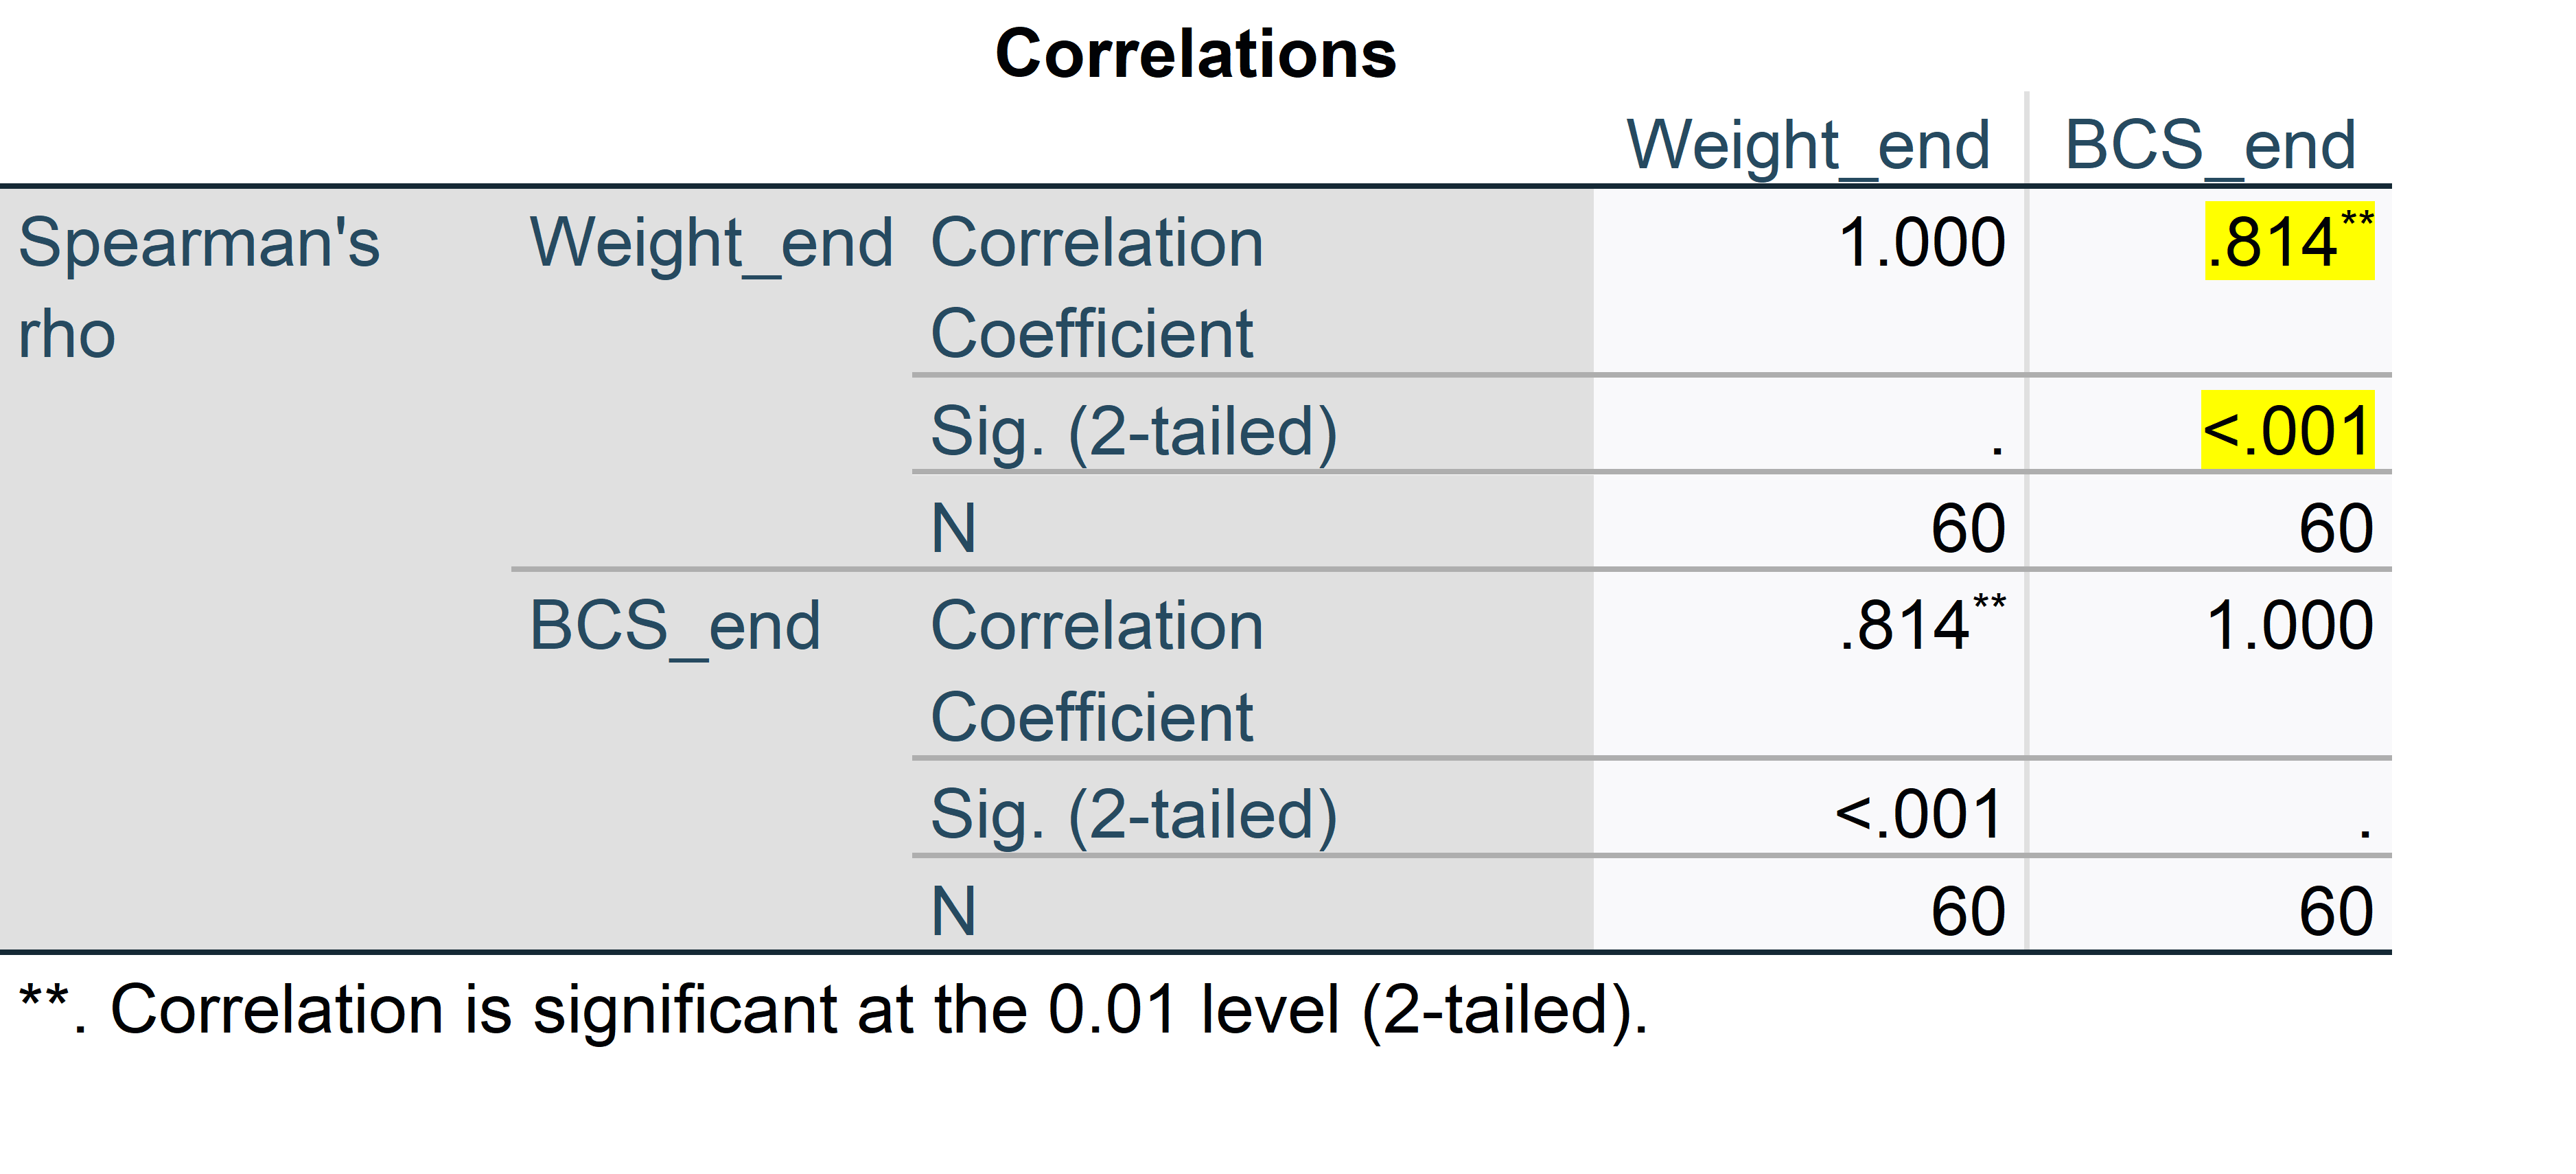
Here you would report an rs value of 0.814 and a significant correlation with P<0.001. SPSS automatically conducts all of the correlations both ways and the correlation of each variable against itself.
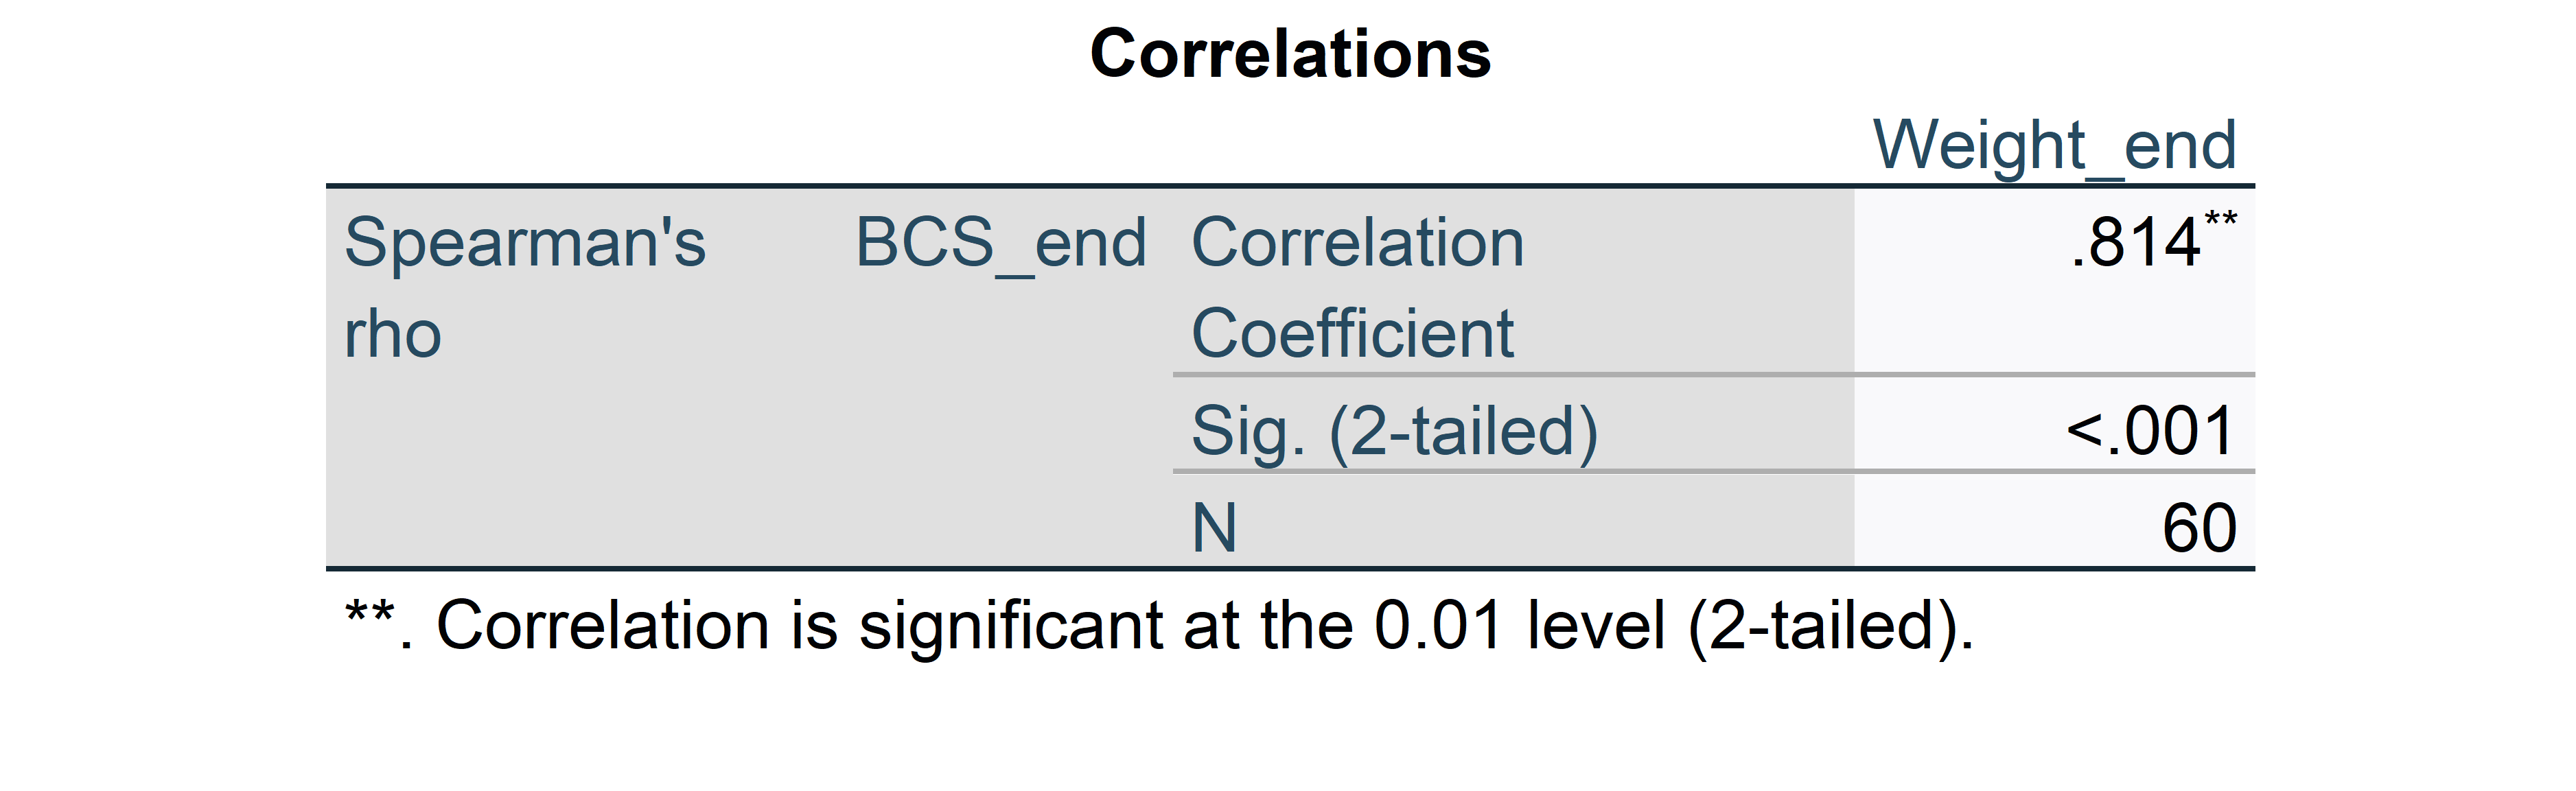
If this is confusing, you can get rid of this by clicking ‘show only lower triangle’ and then deselecting ‘show diagonal’ when setting up the test. Then your output will look like this.

Great