-
Course Information
Meet the Teaching Team -
Course Dataset 1
-
Course Dataset 2
-
MODULE A1: INTRODUCTION TO STATISTICS USING R, STATA, AND SPSSA1.1 What is Statistics?
-
A1.2.1a Introduction to Stata
-
A1.2.2b: Introduction to R
-
A1.2.2c: Introduction to SPSS
-
A1.3: Descriptive Statistics
-
A1.4: Estimates and Confidence Intervals
-
A1.5: Hypothesis Testing
-
A1.6: Transforming Variables
-
End of Module A11 Quiz
-
MODULE A2: POWER & SAMPLE SIZE CALCULATIONSA2.1 Key Concepts
-
A2.2 Power calculations for a difference in means
-
A2.3 Power Calculations for a difference in proportions
-
A2.4 Sample Size Calculation for RCTs
-
A2.5 Sample size calculations for cross-sectional studies (or surveys)
-
A2.6 Sample size calculations for case-control studies
-
End of Module A21 Quiz
-
MODULE B1: LINEAR REGRESSIONB1.1 Correlation and Scatterplots
-
B1.2 Differences Between Means (ANOVA 1)
-
B1.3 Univariable Linear Regression
-
B1.4 Multivariable Linear Regression
-
B1.5 Model Selection and F-Tests
-
B1.6 Regression Diagnostics
-
End of Module B11 Quiz
-
MODULE B2: MULTIPLE COMPARISONS & REPEATED MEASURESB2.1 ANOVA Revisited – Post-Hoc Testing
-
B2.2 Correcting For Multiple Comparisons
-
B2.3 Two-way ANOVA
-
B2.4 Repeated Measures and the Paired T-Test
-
B2.5 Repeated Measures ANOVA
-
End of Module B21 Quiz
-
MODULE B3: NON-PARAMETRIC MEASURESB3.1 The Parametric Assumptions
-
B3.2 Mann-Whitney U Test
-
B3.3 Kruskal-Wallis Test
-
B3.4 Wilcoxon Signed Rank Test
-
B3.5 Friedman Test
-
B3.6 Spearman’s Rank Order Correlation
-
End of Module B31 Quiz
-
MODULE C1: BINARY OUTCOME DATA & LOGISTIC REGRESSIONC1.1 Introduction to Prevalence, Risk, Odds and Rates
-
C1.2 The Chi-Square Test and the Test For Trend
-
C1.3 Univariable Logistic Regression
-
C1.4 Multivariable Logistic Regression
-
End of Module C11 Quiz
-
MODULE C2: SURVIVAL DATAC2.1 Introduction to Survival Data
-
C2.2 Kaplan-Meier Survival Function & the Log Rank Test
-
C2.3 Cox Proportional Hazards Regression
-
C2.4 Poisson Regression
-
End of Module C21 Quiz
-
A Note about the Fossa Certificate


Learning Outcomes
By the end of this section, students will be able to:
- Explain the key concept of power and what impacts it
- Estimate the power of a given study
- Estimate the sample size needed to test hypotheses in different study designs
You can download a copy of the slides here: A2.3 Power calculations for a difference in proportions
Video A2.3 Power Calculation for Two Proportions (10 minutes)
A2.3 PRACTICAL: R
Power calculations for two proportions
Here is an example:
Estimate the sample size needed to compare the proportion of people who smoke in two populations. From previous work, you think that 10% of the people in population A smoke, and that an absolute increase of 5% in population B (compared to population A) would be clinically significant. You want 90% power, and a 5% significance level.
In this scenario we use the ‘pwr.2p.test’ command in the power package.
### alpha = sig.level option and is equal to 0.05
### power = 0.80
### p1 = 0.10
### p2 = 0.15
power4<-pwr.2p.test(h=ES.h(p1=0.1, p2=0.15), sig.level=0.05, power=0.9)
With this command, you can specify ‘h=’ for an effect size, or you can ask R to compute an effect size for two propotions with the ‘ES.h(p1, p2)’ option, as we did here.
> power4<-pwr.2p.test(h=ES.h(p1=0.1, p2=0.15), sig.level=0.05, power=0.9)
> power4
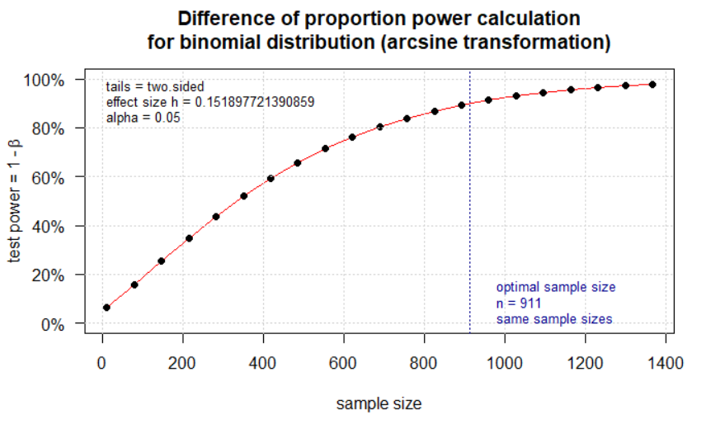
Difference of proportion power calculation for binomial distribution (arcsine transformation)
h = 0.1518977
n = 910.8011
sig.level = 0.05
power = 0.9
alternative = two.sided
NOTE: same sample sizes
You estimate that you need 911 participants from each population, with a total sample of around 1,821. If you wanted different sample sizes in each group, you would use the command ‘pwr.2p2n.test’ instead.
If we type ‘plot(power4)’ we can see how the power level changes with varying sample sizes:
> plot(power4)
Question A2_3: Unfortunately, the funding body has informed you, you only have enough resources to recruit a fixed number of people. Can you estimate the power of a study if you only had 500 people in total (with even numbers in each group)? (hint: type ?pwr.2p.test if you need help setting up the command)
Answer
> power5<-pwr.2p.test(h=ES.h(p1=0.1, p2=0.15), n=250, sig.level=0.05)
> power5
Difference of proportion power calculation for binomial distribution (arcsine transformation)
h = 0.1518977
n = 250
sig.level = 0.05
power = 0.396905
alternative = two.sided
NOTE: same sample sizes
In this scenario, the power of the study would be only 0.40. Most people would regard such a study as under-powered as there is only a 40% chance that the effect will be detected if one truly exists.
A2.3 PRACTICAL: Stata
Power calculations for two proportions
Here is an example:
Estimate the sample size needed to compare the proportion of people who smoke in two populations. From previous work, you think that 10% of the people in population A smoke, and that an absolute increase of 5% in population B (compared to population A) would be clinically significant. You want 90% power, and a 5% significance level.
The command and output is as follows:
power twoproportions 0.1, alpha(0.05) power(0.9) diff(0.05)
*– Estimated sample sizes:
N = 1836
N per group = 918
*– Estimated sample size: 1836 (two groups of 918 each).
You estimate that you need 1836 participants overall, 918 from each population.
Question A2.3: Unfortunately, the funding body has informed you, you only have enough resources to recruit a fixed number of people. Can you estimate the power of a study if you only had 500 people in total?
Answer
power twoproportions 0.1, alpha(0.05) diff(0.05) n(500)
*– Estimated power:
power = 0.3935
In this scenario, the power of the study would be only 0.39. Most people would regard such a study as under-powered as there is only a 39% chance that the effect will be detected if one truly exists.
A2.3 PRACTICAL: SPSS
Power Calculations for Proportions
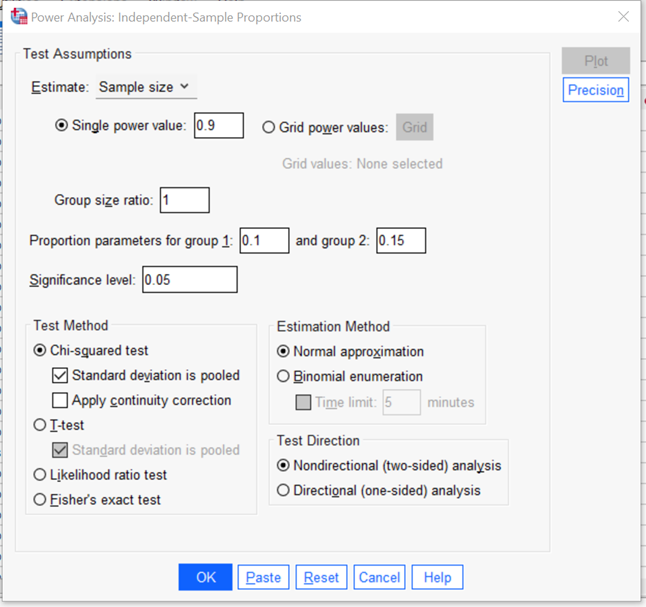
Estimate the sample size needed to compare the proportion of people who smoke in two populations. From previous work, you think that 10% of the people in population A smoke, and that an absolute increase of 5% in population B (compared to population A) would be clinically significant. You want 90% power, and a 5% significance level.
Select
Analyze >> Power Analysis >> Proportions >> Independent Samples Binomial Test
Then input your data into each of the boxes in the Power Analysis window as in the previous practical. Remember that all percentages are expressed as decimals, for 90% is 0.9, 10% is 0.1 etc. Then press OK to run the test.
Unfortunately, the funding body has informed you, you only have enough resources to recruit a fixed number of people. Can you estimate the power of a study if you only had 500 people in total?
Answer
In the first part of the question you estimate that you need 1836 participants overall, 918 from each population.

In the second scenario, the power of the study would be only 0.39. Most people would regard such a study as under-powered as there is only a 39% chance that the effect will be detected if one truly exists.
